Top 8 U.S. Communities With Asian-American Majority Populations
The demographics of Asian Americans describe a heterogeneous group of people in the United States who trace their ancestry to one or more Asian countries.
Manila men began to reside in Louisiana as the first Asian Americans to live in the continental United States. Most Asian Americans have arrived after 1965. These individuals make up one-quarter of all immigrants who have arrived in the U.S. since 1965, and 59% of Asian Americans are foreign-born. During the 2010 United States Census the largest ethnic groups were Chinese Americans, Filipino Americans, Indian Americans, Vietnamese Americans, Korean Americans, and Japanese Americans.
The 2020 United States Census reported approximately 19.9 million people identified as Asian alone in 2020. Adding in the 4.1 million respondents who identified as Asian in combination with another race group, the Asian American population comprised 24 million people (7.2% of the total population).
1. Honolulu County, Hawaii – 54.8%
 |
| Photo: Wikipedia |
Honolulu County (officially known as the City and County of Honolulu, formerly Oahu County) is a consolidated city-county in the U.S. state of Hawaii. The city-county includes both the city of Honolulu (the state's capital and largest city) and the rest of the island of Oʻahu, as well as several minor outlying islands, including all of the Northwestern Hawaiian Islands (islands beyond Niihau) except Midway Atoll.
Across most of America, the African American and Hispanic communities comprise "most of the minority". We're not totally sure that's a term, but it's an accurate reflection of the state of race in America.
Asians are a "minority of the minority", generally. But not everywhere.
There are now over 17 million people who identify as an Asian living in America, making up 5.6% of the total population. According to the most recent American Community Survey, the Asian population in Hawaii is 524,609 - at 36.9% of the total population of Hawaii.
And, unlike African Americans that fall under one group in the Census, Asian Americans have many sub-groups -- Chinese, Filipino, and Indian being the three largest sub-groups.
Which city in Hawaii had the largest Asian population? Waipahu took the number one overall spot for the largest Asian in Hawaii for 2021. 66.05% of Waipahu identify as Asian.
2. Daly City, California – 55.6%
 |
| Photo: KQED |
The 2010 United States Census reported that Daly City had a population of 101,123. The population density was 13,195.0 people per square mile (5,094.6/km2), placing it 291st in population, among the top 50 in density when smaller populations are included, and 9th in density amongst cities with over 100,000 people.
The racial makeup of Daly City was 56,267 (55.6%) Asian, 23,842 (23.6%) White, 3,600 (3.6%) African American, 805 (0.8%) Pacific Islander, 404 (0.4%) Native American, 11,236 (11.1%) from other races, and 4,969 (4.9%) from two or more races.
It is the largest city with a majority Asian population in the contiguous United States.
Among the total population of Daly City, 33.2% were Filipino, 15.4% Chinese, 1.8% Burmese, 1.0% Vietnamese, 0.6% Indian, 0.6% Korean, 0.6% Japanese, 0.2% Indonesian, and 0.2% were Thai. Hispanic or Latino of any race were 23,929 persons (23.7%); 9.4% of Daly City's population is of Mexican origin; 4.9% is of Salvadoran, 2.7% Nicaraguan, 1.3% Guatemalan, 0.7% Peruvian, 0.7% Puerto Rican, and 0.5% Honduran heritage.
The Census reported that 100,442 people (99.3% of the population) lived in households, 273 (0.3%) lived in non-institutionalized group quarters, and 408 (0.4%) were institutionalized.
3. Fremont, California – 50.6%
 |
| Photo: LoopNet |
As of 2010 more than half the residents of Fremont were of Asian ancestry, with large populations of Chinese, Asian Indians, and Filipinos.
The racial makeup of Fremont was:
108,332 (50.6%) Asian (consisting of 18.1% Indian, 17.8% Chinese, 6.7% Filipino, 2.5% Vietnamese, 1.8% Korean, 1.0% Pakistani, 0.8% Japanese, 0.6% Burmese)
70,320 (32.8%) White, Non-Hispanic Whites were 26.5% of the population in 2010, down from 85.4% in 1970.
31,698 (14.8%) Hispanic or Latino of any race. (consisting of 11.0% Mexican, 0.6% Puerto Rican, 0.5% Salvadoran).
13,605 (6.4%) from other races,
12,584 (5.9%) from two or more races
7,103 (3.3%) African American,
1,169 (0.5%) Pacific Islander,
976 (0.5%) Native American,
Due in large part to a substantial influx of Afghans granted asylum in the United States following the 1979 invasion of Afghanistan by the Soviet Union, Fremont is the home to the largest concentration of Afghan Americans in the United States. Judith Miller of City Journal wrote that, unlike many ethnic groups, the Afghans in Fremont have few political representatives at various levels and an insular focus. This concentration is noted in Khaled Hosseini's 2003 novel Kite Runner.
Fremont and nearby Union City have fairly large numbers of Pacific Islanders, Cubans, and Puerto Ricans, Spanish and Portuguese, and a small number of American Indians.
4. Sunnyvale, California - 40.9%
 |
| Photo: Sunnyvale Chamber of Commerce |
The 2010 United States Census reported that Sunnyvale had a population of 140,081. The population density was 6,173.9 people per square mile (2,383.8/km2). The racial makeup of Sunnyvale was 60,193 (43.0%) White, 2,735 (2.0%) African American, 662 (0.5%) Native American, 57,320 (40.9%) Asian, 638 (0.5%) Pacific Islander, 12,177 (8.7%) from other races, and 6,356 (4.5%) from two or more races. Hispanic or Latino of any race were 26,517 persons (18.9%). Non-Hispanic Whites were 34.5% of the population in 2010, compared to 74.7% in 1980.
The Census reported that 139,232 people (99.4% of the population) lived in households, 380 (0.3%) lived in non-institutionalized group quarters, and 469 (0.3%) were institutionalized.
There were 53,384 households, out of which 18,614 (34.9%) had children under the age of 18 living in them, 28,583 (53.5%) were opposite-sex married couples living together, 4,629 (8.7%) had a female householder with no husband present, 2,341 (4.4%) had a male householder with no wife present. There were 2,386 (4.5%) unmarried opposite-sex partnerships, and 357 (0.7%) same-sex married couples or partnerships. 13,457 households (25.2%) were made up of individuals, and 3,775 (7.1%) had someone living alone who was 65 years of age or older. The average household size was 2.61. There were 35,553 families (66.6% of all households); the average family size was 3.15.
The population was spread out, with 31,435 people (22.4%) under the age of 18, 9,350 people (6.7%) aged 18 to 24, 50,919 people (36.3%) aged 25 to 44, 32,721 people (23.4%) aged 45 to 64, and 15,656 people (11.2%) who were 65 years of age or older. The median age was 35.6 years. For every 100 females, there were 101.5 males. For every 100 females age 18 and over, there were 100.9 males.
There were 55,791 housing units at an average density of 2,458.9 per square mile (949.4/km2), of which 25,623 (48.0%) were owner-occupied, and 27,761 (52.0%) were occupied by renters. The homeowner vacancy rate was 1.1%; the rental vacancy rate was 4.4%. 68,895 people (49.2% of the population) lived in owner-occupied housing units and 70,337 people (50.2%) lived in rental housing units.
5. Irvine, California – 39.2 %
 |
| Photo: Extra Space Storage |
New census estimates show that, for the first time, Irvine has more Asian than white residents. It’s a thin lead, well within the report’s margin of error, but the strongest evidence yet of what many residents, scholars and real estate professionals see as an accelerating trend.
Using the new census figures, a Register analysis indicates Irvine now is – or soon will be – the largest city in the continental United States with an Asian plurality. Among larger municipalities, only Honolulu has more Asians than any other race.
More than 45 percent of Irvine’s roughly 257,000 residents are Asian, according to American Community Survey estimates released Thursday.
And it is partly the city’s evolution as a decidedly upscale and aspirational multinational community that is increasing its appeal at home and abroad – and setting it apart from some Asian residential and cultural magnets, such as Little Saigon in Westminster and Garden Grove, or the “Chinatowns” of many major cities, experts say.
Jeanne Batalova, a senior policy analyst and demographer at the Migration Policy Institute in Washington, D.C., quipped that Irvine has proven such a powerful draw for well-to-do Asian families that the city should consider switching its official vegetable (yes, it has such a thing) from asparagus to Chinese bok choy or Japanese daikon radish.
6. Santa Clara, California
 |
| Photo: Realtor.com |
In Santa Clara County, people who identify as Asian are now the largest racial group or ethnic group for the first time, representing 38.9% of the county’s 2020 population of 1,936,239, according to census numbers released today. The county’s Asian population grew by more than one-third, by nearly 190,000, over the 2010 census numbers.
Santa Clara County’s Hispanic or Latino population grew, but at a slower pace, by just over 8,000 people, in the last decade. This group represents 25.2% of the 2020 population count for the county.
The 2020 Census reported about 71,000 additional white residents over 2010, while the county proportion of the population of this group fell to 28.7%.
The new U.S. Census data released on Thursday also showed significant increases nationally among people who identify as multi-racial, with Hispanic and Asian populations driving much of the nation's population growth between 2010 and 2020.
Santa Clara County was one of the fastest-growing counties in California in the past decade, growing to 1,936,259, an 8.7% increase, the fifth-fastest-growing among the state’s top 10 counties in population.
The fastest-growing counties were Trinity, with just 16,000 people, at 16.9%, followed by Placer and nearby San Benito, at 16.2% growth over the last decade.
The census also today reported that Santa Clara County had the third-highest percentage of growth in housing units in the state, adding more than 56,000 units.
7. Garden Grove, California – 37.1%
 |
| Photo: Visit Anaheim |
The 2010 United States Census reported that Garden Grove had a population of 170,883. The population density was 9,515.3 people per square mile (3,673.9/km2). The racial makeup of Garden Grove was 68,149 (39.9%) White, 2,155 (1.3%) Black, 983 (0.6%) Native American, 63,451 (37.1%) Asian, 1,110 (0.6%) Pacific Islander, 28,916 (16.9%) from other races, and 6,119 (3.6%) from two or more races. Hispanic or Latino of any race were 63,079 persons (36.9%). Non-Hispanic whites were 22.6% of the population, down from 90.6% in 1970. Vietnamese Americans numbered 47,331 of the population. At 27.7% this was the highest concentration of any city in the United States except for adjacent Westminster.
The Census reported that 168,942 people (98.9% of the population) lived in households, 1,234 (0.7%) lived in non-institutionalized group quarters, and 707 (0.4%) were institutionalized.
There were 46,037 households, out of which 21,361 (46.4%) had children under the age of 18 living in them, 26,659 (57.9%) were opposite-sex married couples living together, 6,866 (14.9%) had a female householder with no husband present, 3,588 (7.8%) had a male householder with no wife present. There were 2,025 (4.4%) unmarried opposite-sex partnerships, and 269 (0.6%) same-sex married couples or partnerships. 6,491 households (14.1%) were made up of individuals, and 2,842 (6.2%) had someone living alone who was 65 years of age or older. The average household size was 3.67. There were 37,113 families (80.6% of all households); the average family size was 3.94.
8. Torrance, California – 34.5%
 |
| Photo: CaliforniaBeaches.com |
The 2010 United States Census reported that Torrance had a population of 145,438. The population density was 7,076.1 people per square mile (2,732.1/km2). The racial makeup of Torrance was 74,333 (51.1%) White, 50,240 (34.5%) Asian, 3,955 (2.7%) African American, 554 (0.4%) Native American, 530 (0.4%) Pacific Islander, 7,808 (5.4%) from other races, and 8,018 (5.5%) from two or more races. Hispanic or Latino of any race were 23,440 persons (16.1%), while non-Hispanic whites formed 42.3% of the population.
The Census reported that 144,292 people (99.2% of the population) lived in households, 506 (0.3%) lived in non-institutionalized group quarters, and 640 (0.4%) were institutionalized.
There were 56,001 households, out of which 18,558 (33.1%) had children under the age of 18 living in them, 29,754 (53.1%) were opposite-sex married couples living together, 6,148 (11.0%) had a female householder with no husband present, 2,510 (4.5%) had a male householder with no wife present. There were 2,152 (3.8%) unmarried opposite-sex partnerships, and 309 (0.6%) same-sex married couples or partnerships. 14,472 households (25.8%) were made up of individuals, and 5,611 (10.0%) had someone living alone who was 65 years of age or older. The average household size was 2.58. There were 38,412 families (68.6% of all households); the average family size was 3.14.
The population was spread out, with 31,831 people (21.9%) under the age of 18, 10,875 people (7.5%) aged 18 to 24, 38,296 people (26.3%) aged 25 to 44, 42,710 people (29.4%) aged 45 to 64, and 21,726 people (14.9%) who were 65 years of age or older. The median age was 41.3 years. For every 100 females, there were 94.7 males. For every 100 females age 18 and over, there were 91.8 males.
There were 58,377 housing units at an average density of 2,840.3 per square mile (1,096.6/km2), of which 31,621 (56.5%) were owner-occupied, and 24,380 (43.5%) were occupied by renters. The homeowner vacancy rate was 0.8%; the rental vacancy rate was 5.3%. 85,308 people (58.7% of the population) lived in owner-occupied housing units, and 58,984 people (40.6%) lived in rental housing units.
As of March 2019, Torrance had a median household income of $85,070 and a median family income of $102,637.
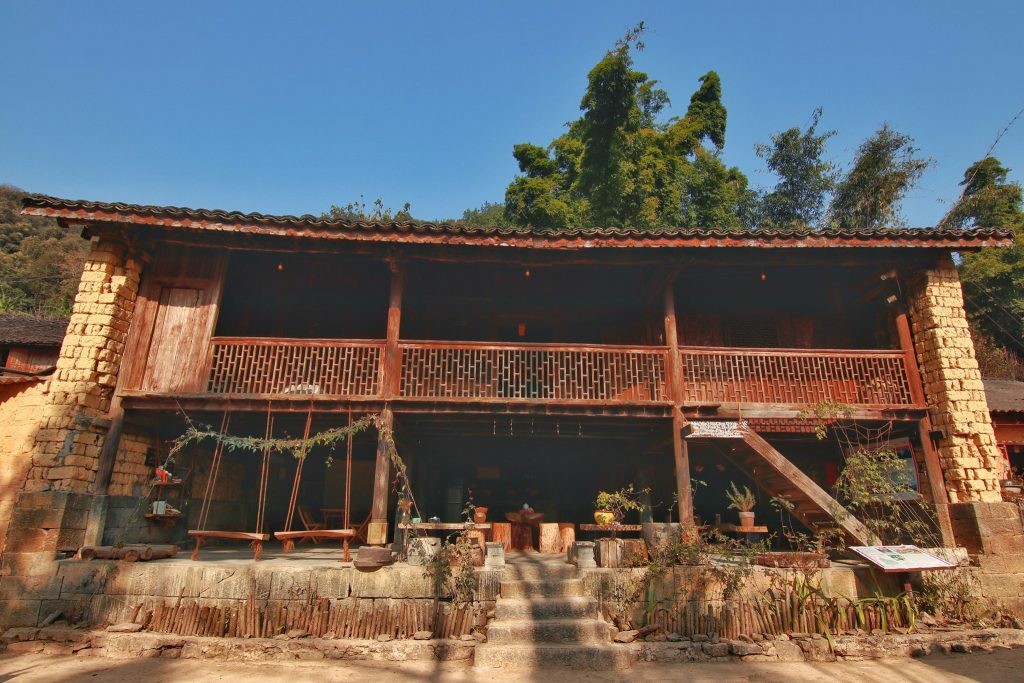
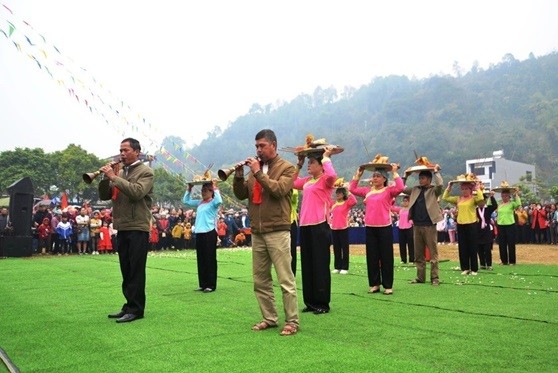
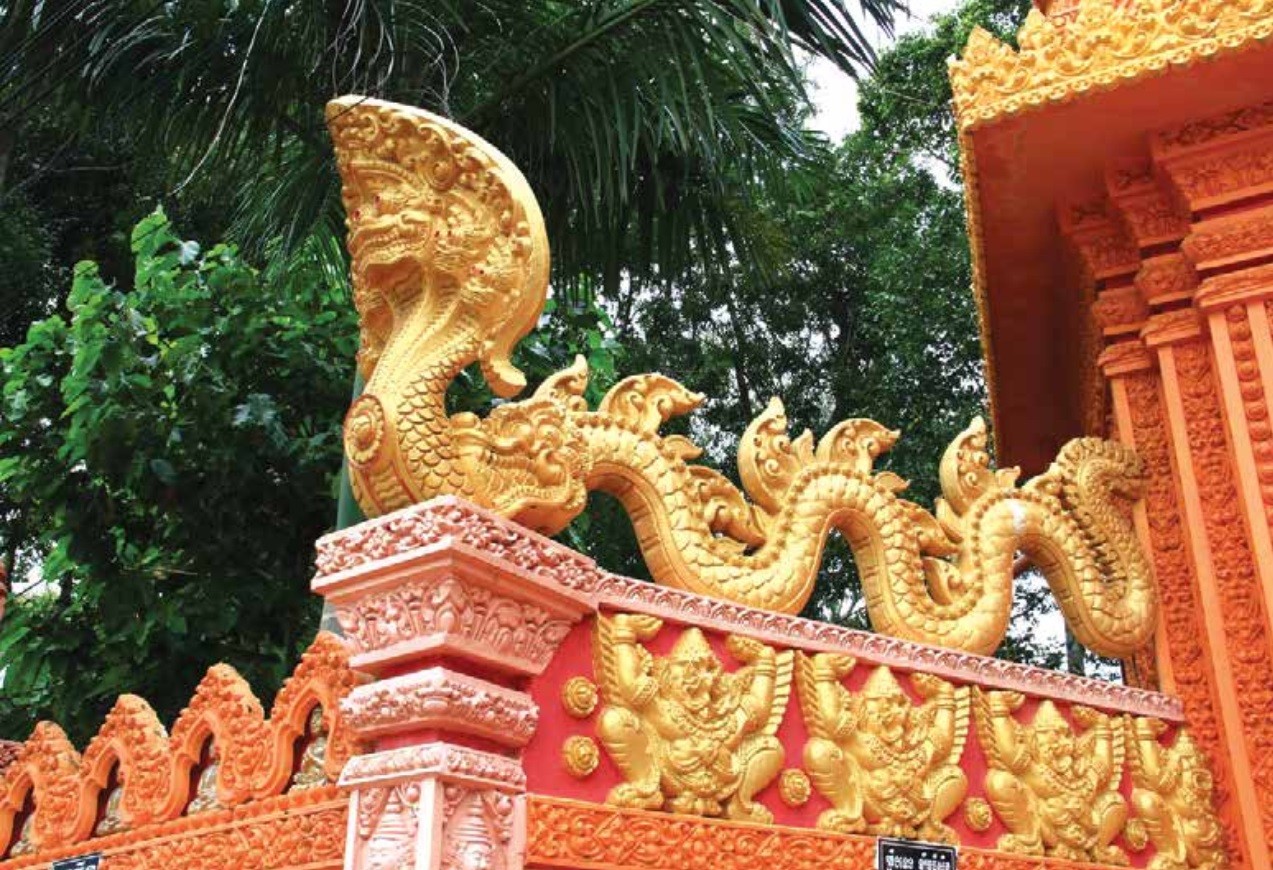
 | Exploring the Charming Village Influenced by 3 Asian Cultures At this special village, Thai, Vietnamese and Chinese cultures collided. |
 | She is Half Asian Half What? Female Models You Never Thought Was Asian These stunning faces, and their powerful steps on the runway wowed the world once, but their Asian-root ethinicity left many speechless. |
 | The Most Barrier-Breaking Asian American Choreographers in the World Some of the world famous dance artists today have a special Asian root. Many have been mainstreamed accounts to the world of performance and choreography. |
Related Stories
 Travel
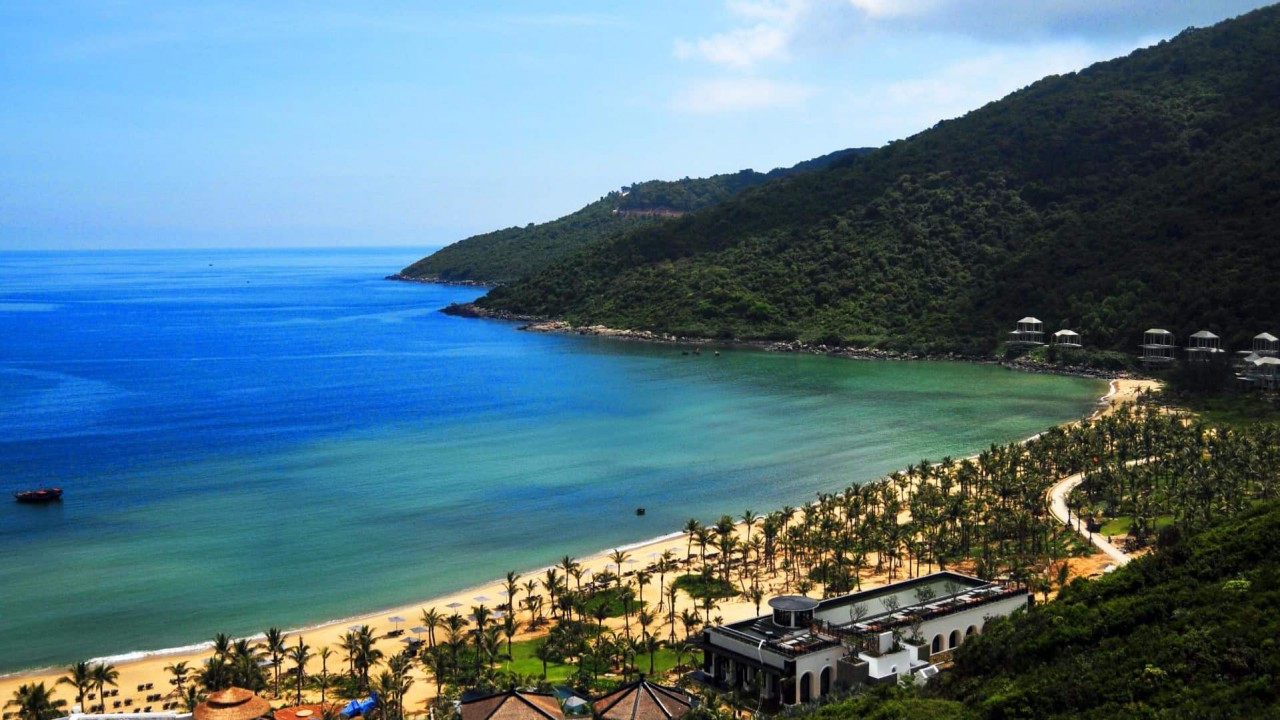
Top 8 Most Beautiful Beaches To Visit This Summer Trip In Vietnam
 Travel
Top 8 Most Beautiful Homestays in Meo Vac, Ha Giang
Recommended
 Handbook
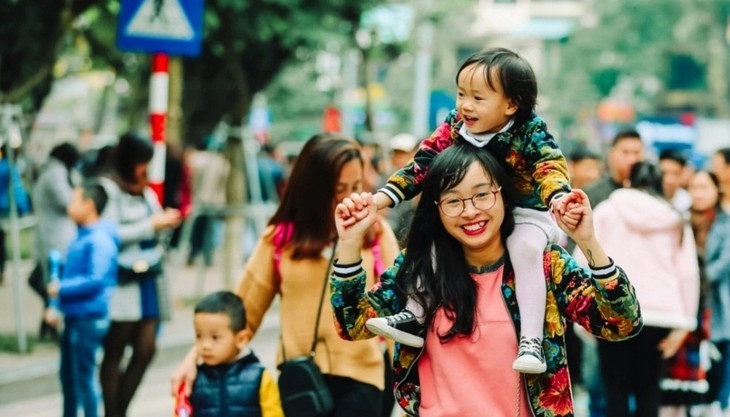
Vietnam Moves Up 8 Places In World Happiness Index
 Handbook
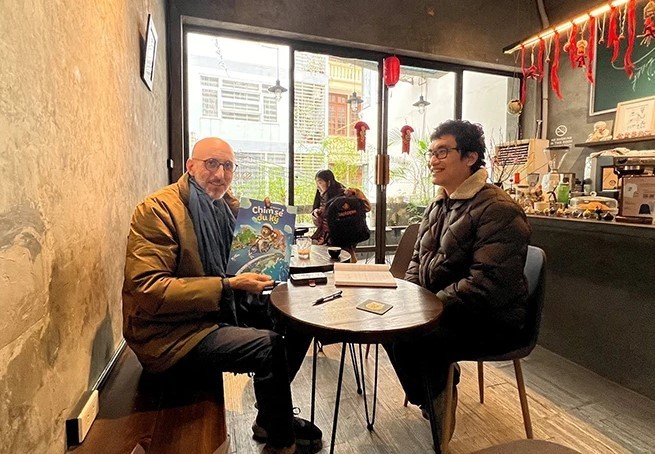
Travelling Vietnam Through French Artist's Children Book
 Multimedia
Vietnamese Turmeric Fish among Best Asian Dishes: TasteAtlas
 Handbook
From Lost to Found: German Tourist Thanks Vietnamese Police for Returning His Bag
 Handbook
Prediction and Resolution for the Disasters of Humanity
 Handbook
16 French Films To Be Shown For Free During Tet Holiday In Vietnam
 Handbook
Unique Cultural and Religious Activities to Welcome Year of the Snake
 Handbook