Gold price outlook: pullback on the cards while US-China's tensions is increasing
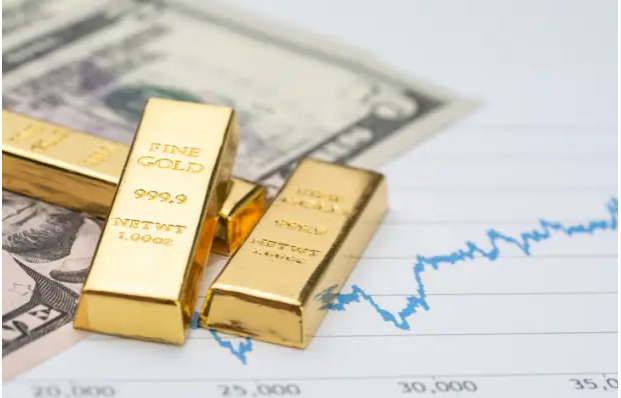 |
| Gold prices could hit past the Rs 70,000 mark over the next two years (Photo: FX Empire) |
Gold, XAU/ USD, inflation expectations
According to Daily FX, the central bank’s $3 trillion balance sheet expansion, to help shelter the US economy from the coronavirus pandemic, has substantially devalued the US Dollar and fueled long-term inflation fears.
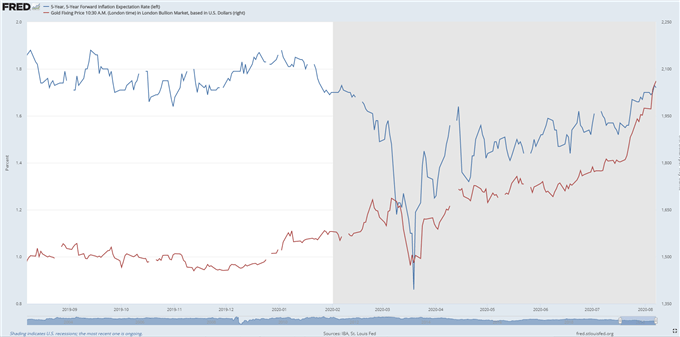
This has stoked the appeal of gold as a hedge against inflation and reflected in the positive correlation seen between 5-year forward inflation expectations and bullion prices.
Inflation Expectations vs Price of Gold (2019-Present)
 |
| (Photo: FRED) |
Furthermore, the performance of the anti-fiat metal in times of elevated volatility belies its purported ‘safe haven’ aspects. It tends to be relatively uninfluenced by the oscillations seen in the markets primary fear-gauge, the VIX.
However, gold’s susceptibility to the performance of the US Dollar may cap potential upside for the time-being as escalating tensions between the United States and China begin to weigh on market sentiment.
As tit-for-tat exchanges burgeon investor’s appetite for the Greenback, a period of US Dollar strength looks in the offing should the Trump Administration expectedly ramp up anti-China rhetoric ahead of US elections in November.
On the other hand, a distinct de-escalation between the world’s two largest economies could see the ‘goldilocks’ environment for gold continue and potentially see the precious metal extend its historic climb above the $2,000/oz mark.
Gold Correlation Matrix (2018 – Present)
 |
| (Photo: Bloomberg) |
Gold price daily chart, near-term pullback in the offing
 |
| (Photo: FRED) |
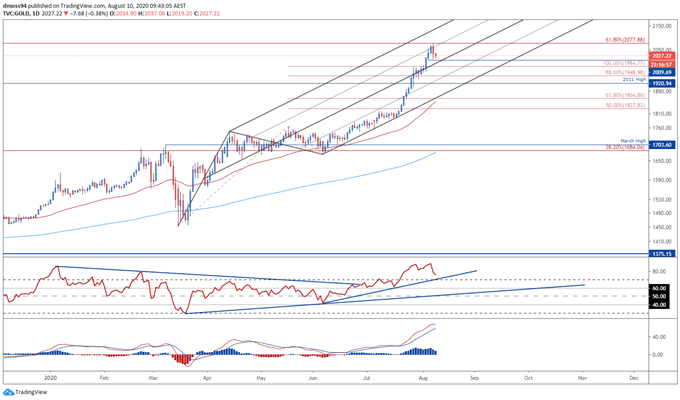
From a technical perspective, resistance at the 61.8% Fibonacci extension (2,077.88) may continue to cap upside potential as RSI divergence suggests a near-term pullback is on the cards.
Moreover, the development of the MACD indicator hints at underlying exhaustion and could encourage sellers should it cross back below its ‘slower’ signal line counterpart, after pushing to its most extreme daily readings since August 2011.
With that in mind, prices may slide back to psychological support at the $2,000/oz mark before gearing up to test the yearly high (2075.15).
A daily close above the 61.8% Fibonacci is needed to validate bullish potential and open a path to test the $2,100/oz mark.
Conversely, a break below the August 5 low (2009.69) and the Schiff Pitchfork median line could lead to a more sustained pullback in the price of bullion. Key regions of support falling at the July high (1984.22) and August low (1960.60).
What's about gold price this week?
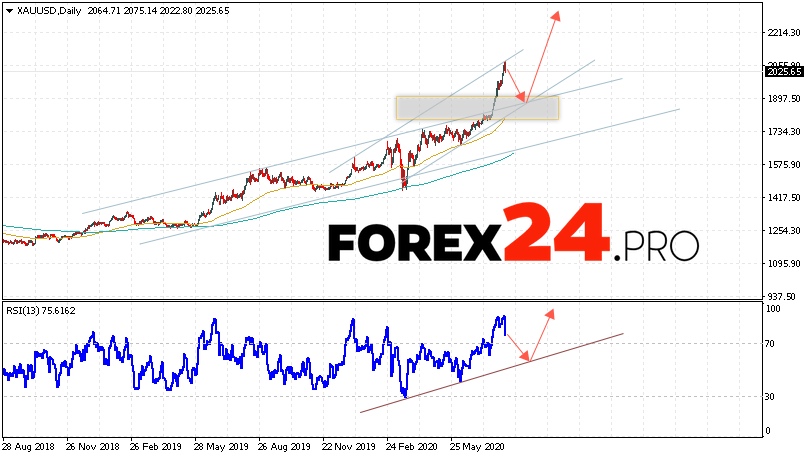
According to Forex 24, an additional signal in favor of a rise in quotes and prices for GOLD in the current trading week August 10 — 14, 2020 will be a test of the rising trend line on the relative strength index (RSI). The second signal will be a rebound from the lower border of the ascending channel. Cancellation of the growth option for XAU/USD quotes will be a fall and a breakdown of the area of 1765. This will indicate a breakdown of the support level and a continued fall in gold prices with a target below 1575. Confirmation of the growth in the value of the asset will be a breakdown of the resistance area and closing of quotes above the level of 2055.
 |
| (Photo: Forex 24) |
GOLD Price Forecast and Analysis August 10 — 14, 2020 assumes an attempt to test the support level near the 1895 area. Then, the gold prices will continue to rise with a target above the level of 2235. A test of the trend line on the relative strength index (RSI) will be in favor of raising the quotes. Cancellation of the GOLD growth option will be a fall and a breakdown of the level of 1765. This will indicate a continued decline in quotations to the area below the level of 1575.
 | Gold Prices Today (August 6): Continues To Skyrocket After nearly a week of stability, the world gold price unexpectedly increased to USD 2,030/ounce and then decreased to USD 2,014.5/ounce yesterday on August 5. ... |
 | Gold Price Today August 1: continues to ascend after minor drop Today on 1/8, gold prices in Asian market reversed to go up in the last trading session of July, recording the best month of increase ... |
 | Vietnamese students rank second at 2020 International Chemistry Olympiad All four Vietnamese students competing in the International Chemistry Olympiad 2020 in Turkey won gold medals, which is the highest-ever result gained by the Vietnamese ... |
 World
World
Gold price today: Staying past-$2,000 off-late, recover happens quicker than expected
 World
World


